
Sugar levels rise in desserts and confectionery despite 20 percent reduction goal, finds PHE report


24 Sep 2019 --- In contrast to the roaring success of the UK Soft Drink Industry Levy (SDIL), which saw sugar in soft drinks fall by 29 percent from 2015 to 2018, the food industry is lagging far behind with an average reduction of just 2.9 percent. This is according to Public Health England (PHE)’s second-year report on the progress made by the food industry to voluntarily reductions of sugar in the foods contributing the most sugar to children’s diets. In part two of NutritionInsight’s coverage of the findings, it becomes clear that the initial target of a 20 percent reduction by 2020 may be wildly unattainable.
“The reformulation program is set over four years to allow for the technical complexities and to reduce sugar gradually to allow for consumers to adjust their taste buds. However, the recent report highlighted very poor progress. Despite a 10 percent sugar reduction aim in the first two years, we have seen just a 2.9 percent reduction. There is a distinct lack of motivation from companies to engage in the process and as we saw with the SDIL, mandatory measures can provide greater reductions,” Holly Gabriel, Registered Nutritionist at Action on Sugar, tells NutritionInsight.
This lack of motivation is despite overall calorie reduction increasingly becoming a critical component of food design - and something that is only going to increase.
PHE’s sugar reduction plan launched as part the Childhood Obesity Plan, yet the report notes that now, a third of children are leaving elementary school as overweight or obese, while severe obesity in children aged 10 to 11 has reached an all-time high. To address this, businesses have three options to meet the 20 percent ambition. They can reformulate, produce smaller portions, or encourage consumers to purchase lower or no sugar products.
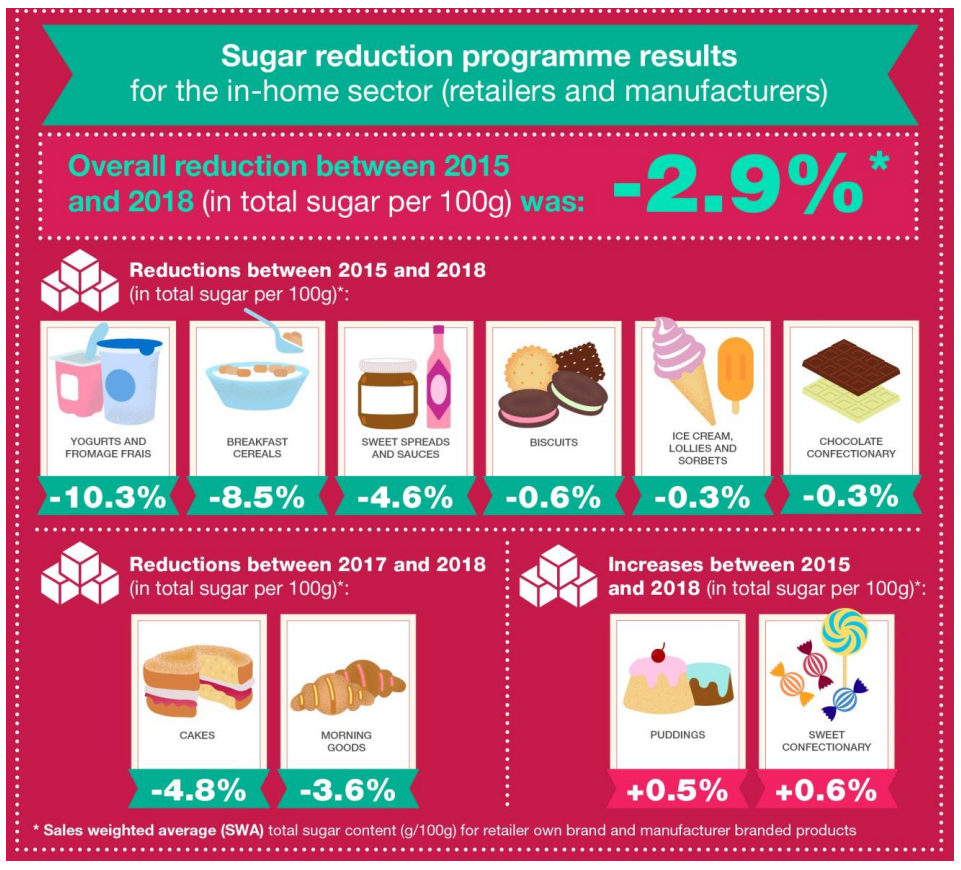 The results varied widely between sectors. (Source: PHE)While yogurt and cereals lead, confectionery and desserts lag behind
Manufacturers made more progress than retailers in terms of total sugar per 100g, seeing a reduction of 3.3 percent in comparison to 1.5 percent. This carried over in terms of the number of calories for products likely to be consumed on a single occasion, where manufacturers had a decrease of 2.1 percent while retailers had an increase of 1.7 percent. However, retailers did have the edge for chocolate, confectionery, puddings (desserts) and morning goods in terms of sugar per 100g, and for biscuits, chocolate, confectionery, yogurt, cakes and morning goods in terms of calories per portion.
“One factor of success must be peer pressure – there has been a bigger shift, for example, across the whole breakfast cereal brands to move to healthier options. Breakfast cereals have been in the spotlight for health campaigners. We’ve seen broader adoption of front-of-pack traffic light labeling, and retailers also wanting healthier breakfast options on shelves as part of their own health commitments,” notes Barbara Crowther, Coordinator at Children’s Food Campaign.
Indeed, aside from yogurts and fromage frais – which saw an in-home reduction of 10.3 percent, the most successful sector was breakfast cereals, where sugar content dropped 8.5 percent in-home. Meanwhile, other sectors including sauces, cakes and morning goods saw low levels of reductions. Biscuits, ice cream and chocolate all had extremely minor levels of reduction, where puddings and confectionary actually had increased sugar levels.
However, due to technical limitations and issues around consumer acceptability in the chocolate and confectionery space, the primary mechanism used to cut calories is reducing the portion size, notes the report. This is because reducing sugar could alter the taste or texture of the product significantly. Therefore, it was necessary to calculate whether there was a reduction in the number of calories consumed on one occasion. Nevertheless, overall, there was virtually no change with a shift from 148 calories per portion in 2015 to 147 calories in 2018.
At a category level, likely calorie intake over a single occasion did decrease for some types of food. Yogurts and fromage frais saw a 7.1 percent dip, while chocolate and confectionary had 4.0 and 5.1 percent drops, respectively. Meanwhile, puddings increased calorie intake by 4.3 percent, while ice creams stood at 3.8 percent.
“Large food and drink manufacturers that sell a wide range of products may look at product reformulation on a category-by-category basis. Some categories may be prioritized to be reformulated for the first few years, and then the focus could be shifted to others in the final years. Some product categories may be more complex, needing a longer period to work out technicalities of reformulation,” explains Gabriel.
Ultimately, the groups – along with the British Dietetic Association (BDA) – stress that further steps should be taken to reduce sugar intake. “If we are to curb the UK’s escalating childhood obesity epidemic then the government must enforce measures to create a more healthy food environment, such as mandatory uniform color-coded labeling on front of packs, product reformulation with a 50 percent reduction in sugar across all products, a tax on calorie-dense processed foods and milk-based drinks and ensure that only healthy products are marketed and advertized,” concludes Gabriel.
Part one of NutritionInsight’s coverage of PHE’s examined the success of Soft Drink Industry Levy, which saw a 29 percent sugar reduction in beverages.
By Katherine Durrell